2024 RevisitationSTUDYThe State of Online Learning (2015)
Introduction
This analysis revisits insights drawn from 1,051 survey responses collected in 2015 as part of the Online Learning Experiences Survey.
At a time when online learning was just in infancy, these responses shed light on early adopters’ experiences, preferences, and challenges. Since then, the landscape of online learning has undergone transformative changes, driven by technological advancements and a global pivot towards digital education platforms. This report aims to contextualize these findings within the broader evolution of online education and speculate on future directions based on current trends.
2015 Data & Analysis
2024 Assessment
Geographics
Using latitude and longitude information on respondents to determine how many were international and domestic and from which states they came. Approximately 27{4a69b362dd93a6614faf85c52b9015285f559d111cd601458465c7420b0c0def} (284) were international. For the 767 U.S. respondents, 108 of these came from California. Other popular states were Florida (56), New York (39), Pennsylvania (38), and Texas (36). A total of 45 states and DC were represented in the sample.
The original analysis highlighted the global reach of online learning, with approximately 27{4a69b362dd93a6614faf85c52b9015285f559d111cd601458465c7420b0c0def} of respondents located outside the United States. Today, this global footprint has expanded, driven by improved internet access and the globalization of education platforms. The disparity in access quality and the digital divide remain significant challenges, underscoring the need for inclusive strategies that accommodate diverse geographic and socio-economic contexts.
Learning Contexts & Formats
TABLE 1 contains the frequency distribution for online class formats. A majority of respondents have participated in university for-credit classes. The next most frequent group was corporate training, which applied to nearly a quarter of respondents.
- K-12 8.5%
- Higher Ed – University – Credit 63.7%
- Higher Ed – University – Non-Credit 13.1%
- MOOC 8.5%
- Corporate Training / Professional Development 24.3%
- Other 6.8%
Synchronous & Asynchronous Modalities
Q: Did your online class include live class sessions?
%
Included Live Components
In 2015, a majority of respondents had engaged in university for-credit classes online. Since then, the proliferation of Massive Open Online Courses (MOOCs), micro-credentials, and coding bootcamps has diversified the online learning ecosystem. These formats cater to a broader range of learning objectives, from lifelong learning to rapid skill acquisition, reflecting a shift towards more flexible and outcome-oriented education.
EXPERIENECE RATINGS
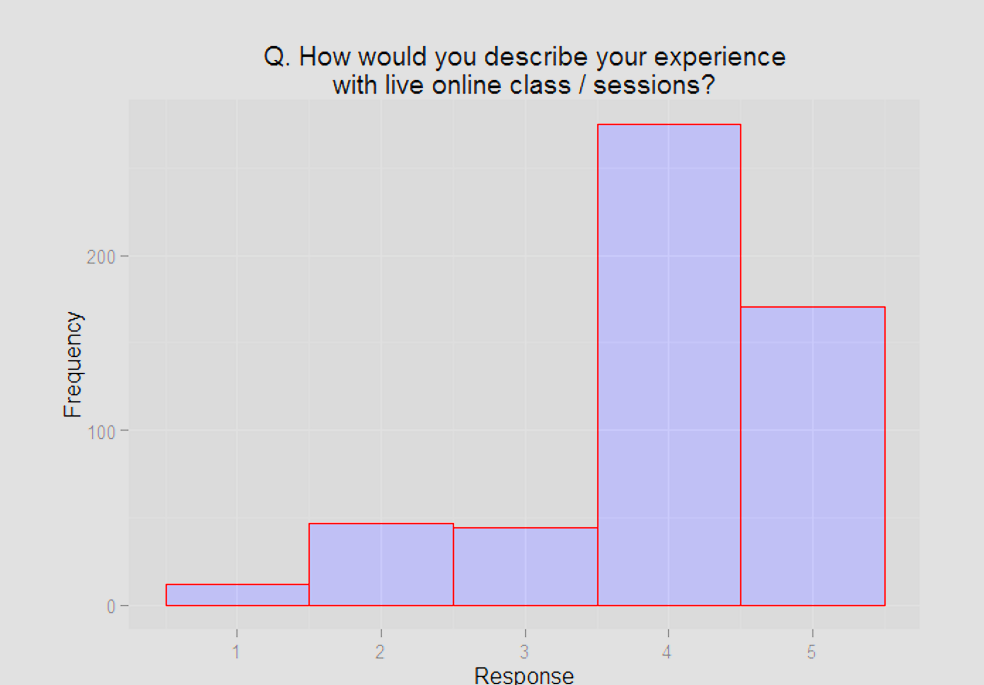
Q:How would you describe your experience with live online class / sessions?
For this question of the survey instrucment, a likert scale of 1-5 was represented by emotion face images.
5 is a very satisfied, 1 is a very unsatisfied Respondents were generally very happy with their courses
Of the 589 students who experienced a live class session, 31.1{4a69b362dd93a6614faf85c52b9015285f559d111cd601458465c7420b0c0def} (171) rated it a 5 and 50.1{4a69b362dd93a6614faf85c52b9015285f559d111cd601458465c7420b0c0def} (275) rated it a 4.
Live sessions were favored by a slim majority in 2015, valued for their interactivity and real-time engagement. Advances in streaming technology and interactive platforms have since enhanced the live online learning experience, offering features like breakout rooms, real-time polling, and augmented reality (AR) overlays. However, the convenience and scalability of recorded content continue to make it a staple of online education, suggesting a hybrid-blended approach that leverages the strengths of both live and asynchronous formats.
Technological Comfort and Features
Table 2 contains descriptive statistics for this question. The mean is the simple arithmetic average, standard deviation (SD) is a measure of variability in the answers, and mode is the most common ranking. I have converted the answers to numeric as follows: Most Important = 3, Nice to Have = 2, Least or Unimportant = 1. Thus, a higher mean/mode demonstrates a higher importance for that particular feature.
Hearing the instructor was seen as the most important factor, followed by seeing the instructor’s screen and then by ability to participate by chat/text. The most common rating for these top three features was “Most Important.” The least important factors were seeing other students, breakout group work, polling/voting, and whiteboarding.
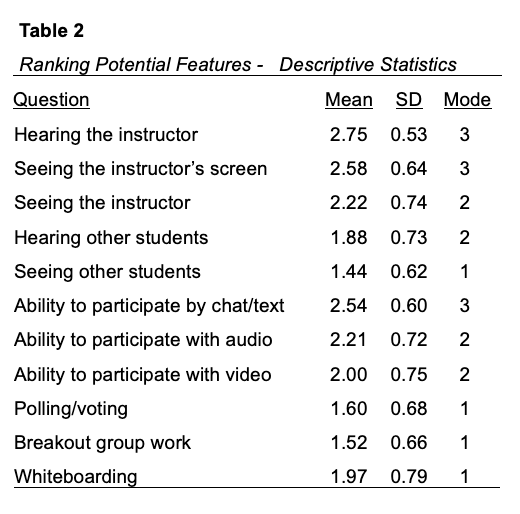
The analysis highlighted a strong preference for essential interactive features such as hearing the instructor (mean rating of 2.75) and seeing the instructor’s screen (2.58). Respondents also valued the ability to participate via chat/text, emphasizing the importance of two-way communication in online learning environments. Despite these preferences, there was a notable divide in comfort with using video/voice participation, with 81.1{4a69b362dd93a6614faf85c52b9015285f559d111cd601458465c7420b0c0def} of respondents indicating comfort, suggesting room for growth in adopting more interactive technologies.
Respondents in 2015 prioritized features like hearing the instructor and seeing their screen. Today’s learners benefit from a range of sophisticated tools that support interactive learning environments, from collaborative whiteboards to AI-powered tutoring systems. The widespread adoption of video conferencing platforms has also increased comfort with voice and video participation, suggesting that future online learning platforms will continue to integrate multimodal interaction.
Interaction and Community Building
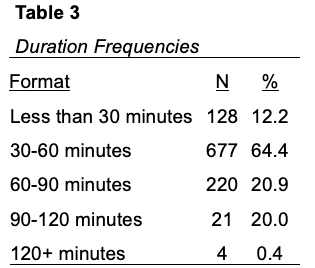
Q: How long should a live online class session last?
The most common response for this question was 30-60 minutes, which was selected by a majority (64.4{4a69b362dd93a6614faf85c52b9015285f559d111cd601458465c7420b0c0def}) of respondents. The 60-90 minutes was a distant second, selected by 20.9{4a69b362dd93a6614faf85c52b9015285f559d111cd601458465c7420b0c0def} of respondents. The results are contained in Table 3.
Q: Would you prefer that the time be filled with:
Respondents were fairly evenly split on this question. Most respondents (53.1{4a69b362dd93a6614faf85c52b9015285f559d111cd601458465c7420b0c0def}, 558) preferred 4-5 shorter activities, while 45.3{4a69b362dd93a6614faf85c52b9015285f559d111cd601458465c7420b0c0def} (477) preferred 1-2 longer activities. A small minority, 1.2{4a69b362dd93a6614faf85c52b9015285f559d111cd601458465c7420b0c0def}, answered “Other.”
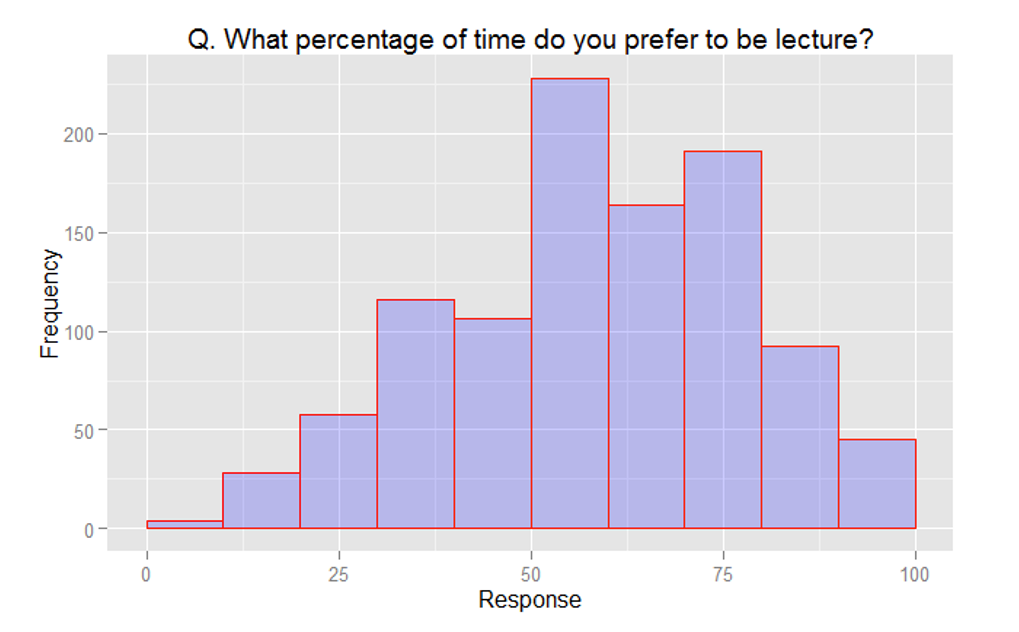
Q: What percentage of time do you prefer to be lecture vs. individual or small group work?
On average, respondents preferred that 57.6{4a69b362dd93a6614faf85c52b9015285f559d111cd601458465c7420b0c0def} of time be spent on lecture, and 42.4{4a69b362dd93a6614faf85c52b9015285f559d111cd601458465c7420b0c0def} on individual or small group work. As you can see in the figure below, there was significant variation in responses. However, the majority (58.8{4a69b362dd93a6614faf85c52b9015285f559d111cd601458465c7420b0c0def}) of respondents stated that lecture should account for between 50 and 80{4a69b362dd93a6614faf85c52b9015285f559d111cd601458465c7420b0c0def} of class time.
Q: Do you believe that an online classroom can be as good as on campus?
A sizeable majority (74.7{4a69b362dd93a6614faf85c52b9015285f559d111cd601458465c7420b0c0def}, 785) of respondents answered yes to this question. In the comments section for this question (Q13), many respondents espoused the positive benefits of online education versus a traditional classroom such as being able to learn at your own pace, improved attendance (might not actually be true…), and increased flexibility. Others stated that the two are equivalent, and that the level of interaction in courses is about the same – “Many lectures have so little interaction that it doesn’t make a difference.” A number of respondents stated that it depends on the quality of the course and the instructor – if both are good then the course can meet or exceed a traditional classroom.
For the negative responses, they overwhelming focused on the perceived lack interaction (with students and professor), social experience, or face-to-face time.
Q: Did your online class require or encourage you to interact with / peers outside of class time?
- YES 48.3%
- NO 51.3%
The importance of community and peer interaction was evident in the survey, with many expressing a desire for more collaborative spaces. Platforms that mimic social media functionalities, offering spaces for informal interaction and collaborative projects, have begun to address this need, emphasizing the role of community in enhancing the online learning experience.
Respondents identified several challenges, including technological issues, a lack of interaction with peers and instructors, and concerns about the effectiveness of online learning compared to traditional classroom settings. These areas highlight the need for improvements in platform reliability, interactive capabilities, and instructional design to enhance the online learning experience.
Q:. Would you interact more with pers if there were a provided space to meet, like a virtual hallway…
A majority of respondents (63.9{4a69b362dd93a6614faf85c52b9015285f559d111cd601458465c7420b0c0def}, 672) answered yes to this question, and 35›.8{4a69b362dd93a6614faf85c52b9015285f559d111cd601458465c7420b0c0def} (376) answered no. A small number of respondents (3) did not provide an answer.
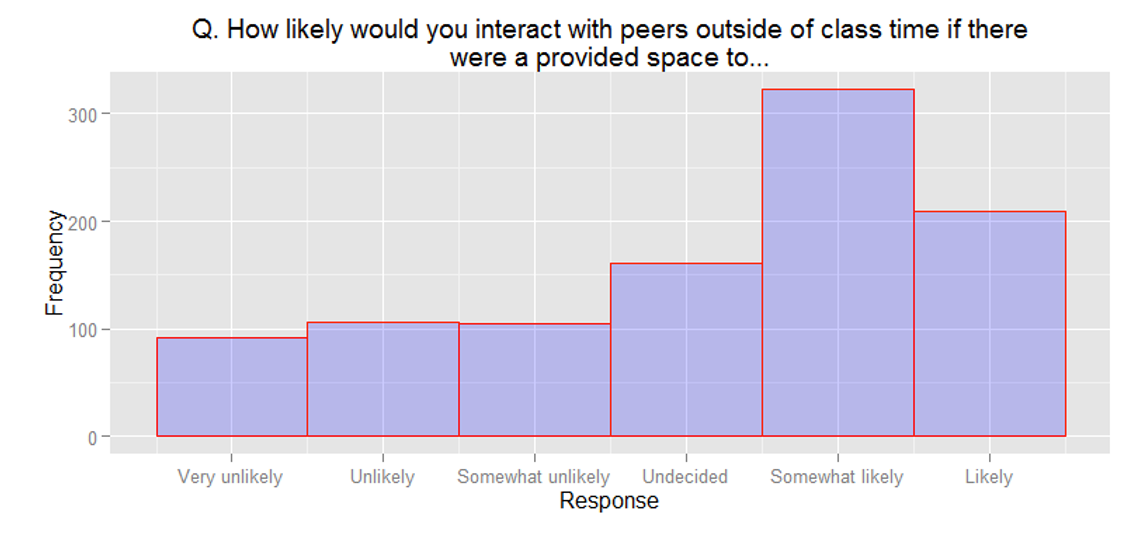
Q. How likely would you interact with peers outside of class time if there were a provided space to…
As you can see in the figure below, responses were fairly uniformly-distributed for this question. “Somewhat likely” was the most common response, followed by “Likely.” Together, the top two answers accounted for a slim majority (50.5{4a69b362dd93a6614faf85c52b9015285f559d111cd601458465c7420b0c0def}) of respondents.
Technology Platforms in 2015
The most commonly-used platform was Skype (41.8{4a69b362dd93a6614faf85c52b9015285f559d111cd601458465c7420b0c0def}), followed by Other (29.4{4a69b362dd93a6614faf85c52b9015285f559d111cd601458465c7420b0c0def}) and then Google Hangouts (21.3{4a69b362dd93a6614faf85c52b9015285f559d111cd601458465c7420b0c0def}). The least common platforms were Vidyo (1.0{4a69b362dd93a6614faf85c52b9015285f559d111cd601458465c7420b0c0def}), Adobe Connect (6.5{4a69b362dd93a6614faf85c52b9015285f559d111cd601458465c7420b0c0def}), and Facetime (7.1{4a69b362dd93a6614faf85c52b9015285f559d111cd601458465c7420b0c0def}). The results for this question are contained within Table 4. I also examined the comments section for this question (Q16). Blackboard was by far the most common “Other” response. Other responses included Canvas, Sakai, Moodle, Angel, and a smattering of other platforms.
- Skype 41.8%
- Google Hangouts (Meet) 21.3%
- Adobe Connect 6.5%
- WebEx 10.4%
- GoToMeeting 10.9%
- Jabber 19%
- Vidyo 1%
- Facetime 7.1%
- Other 29.4%
Looking Ahead
Evolving Learner Preferences
The proliferation of online learning options has led to a diversification of learner preferences, with a growing demand for flexible, self-paced learning opportunities that cater to a variety of lifestyles and learning needs. Future online learning environments will likely need to offer a blend of synchronous and asynchronous formats, along with more personalized learning pathways.
Technological Advancements
Since 2015, there have been significant advancements in online learning technologies, including more robust and user-friendly platforms, the integration of AI for personalized learning, and the use of VR to simulate hands-on experiences. These technologies offer the potential to address many of the challenges identified in the survey, improving accessibility, engagement, and learning outcomes.
Emerging technologies such as artificial intelligence (AI), virtual reality (VR), and blockchain hold promise for addressing current limitations and enhancing online learning. AI could personalize learning at scale, VR could simulate hands-on experiences, and blockchain could secure and streamline the credential verification process. These technologies could radically transform online education, making it more immersive, personalized, and credible.
Summary
While online learning has the potential to democratize education, accessibility and inclusion remain pressing issues. Advances in assistive technologies and universal design principles have improved accessibility, but digital literacy and access disparities continue to pose barriers. Ongoing efforts to address these challenges are crucial to realizing the inclusive potential of online education.
Conclusion
This data analysis presents a snapshot of the early stages of online learning’s evolution. While there were clear areas for improvement, the enthusiasm and engagement of early adopters highlighted the potential of online education to transform learning
Reflecting on the 2015 Online Classroom Survey in the context of subsequent developments highlights both the enduring challenges and the significant progress in online learning. As technology continues to evolve, stakeholders must focus on leveraging these advances to enhance accessibility, engagement, and learning outcomes. The future of online education lies in its ability to adapt to the needs of a diverse global learner population, harnessing technology to offer flexible, inclusive, and engaging learning experiences.
